
Lesson 3 of 9 · 28m
The Profiling Workflow That Finds the Real Bottleneck
From a bad field number to a specific line of code: reproducing under realistic conditions, reading a DevTools trace and a waterfall, and verifying the fix where it counts.
Every team has an engineer who "knows" why the site is slow. Usually it's the thing they complained about in their last code review — the big date library, the framework, the ORM. Sometimes they're right. More often the trace shows something nobody suspected: a tag manager firing synchronously in the head, a 4 MB hero video poster, a JSON.parse of a 1.2 MB inline state blob. The workflow below exists so opinions don't get to skip the evidence.
The loop
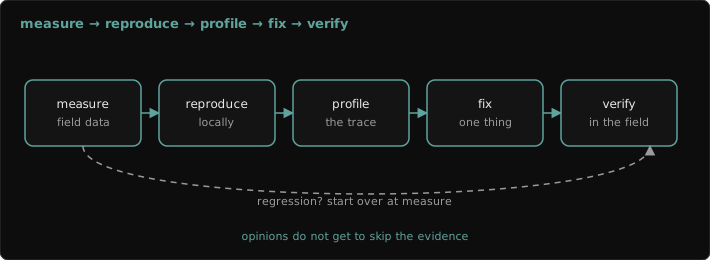
1. FIELD     which metric, which route, which segment is failing at p75?
2. REPRODUCE match that segment in the lab (device, network, cache state)
3. PROFILE   capture a trace + waterfall; identify the sub-part that dominates
4. HYPOTHESIZE one cause, one change, one predicted effect
5. FIX       smallest change that tests the hypothesis
6. VERIFY    lab first (did the sub-part shrink?), then field (did p75 move?)
Skipping step 2 is the classic error: profiling on a fast laptop on a warm cache, you'll optimize a page that's already fine for you.
Reproduce the slow segment
If the failing segment is mid-range Android on 4G, emulate it: in DevTools Performance panel, set CPU throttling to 4x–6x slowdown (calibrate against a real device — newer DevTools offers a calibrated "low-tier mobile" preset) and network to "Slow 4G". Use an Incognito window so extensions don't pollute the trace. Decide whether you're testing a cold load (first visit) or a warm one, and be consistent.
For repeatable lab runs from the command line:
npx lighthouse https://shop.northwindgear.com/product/trail-runner-3 \
  --only-categories=performance \
  --form-factor=mobile --throttling-method=devtools \
  --output=json --output=html --output-path=./reports/pdp \
  --chrome-flags="--headless=new"
Run it at least three to five times and take the median — single Lighthouse runs vary by 10–20% on a shared machine. WebPageTest is worth it for real-device, real-location runs and for its filmstrip, which makes "what did the user actually see at 2 s" impossible to argue with.
Reading the evidence
The network waterfall answers LCP questions. Find the LCP resource and ask: when was it requested relative to the HTML? A long gap is resource load delay — the browser didn't know about it yet. A long bar is load duration — it's too big or fetched from a slow origin. Lots of requests ahead of it at the same priority means it's competing.
The Performance trace answers INP and render-delay questions. Look for:
- Long tasks (red-cornered, over 50 ms) on the Main track — expand them, sort Bottom-Up by self time to find the function that actually burns CPU.
- Purple "Recalculate Style" / "Layout" blocks right after JS — forced synchronous layout from reading geometry after writing styles.
- The Interactions track: each interaction shows input delay, processing, and presentation delay as separate segments.
// Mark your own code so it shows in the trace's Timings track
performance.mark("filters:apply:start");
applyFilters(state);
performance.mark("filters:apply:end");
performance.measure("filters:apply", "filters:apply:start", "filters:apply:end");
console.log(performance.getEntriesByName("filters:apply")[0].duration.toFixed(1), "ms");Verify in the field, not just the lab
A lab improvement is a hypothesis about the field. Ship behind a flag or to a percentage, then compare p75 for the exposed versus control cohort in your RUM, segmented the same way you found the problem. If the lab got faster and the field didn't move, your reproduction didn't match reality — go back to step 2.
Field notes
- Change one thing per experiment. Three simultaneous fixes and a better number teaches you nothing about which one mattered.
- The Bottom-Up tab beats the flame chart for "what's expensive"; the flame chart beats Bottom-Up for "why was it called."
- Third-party scripts show up attributed to their origin in the trace. Make a list; they are frequently half your main-thread time.
- Save traces (they export as JSON) and attach them to the ticket. A trace in a PR description ends more arguments than any benchmark.