
Lesson 1 of 9 · 22m
Core Web Vitals: What the Numbers Actually Mean
LCP, INP, and CLS as user experiences rather than scores — the thresholds, the p75 rule, and the LCP sub-parts that tell you where to dig.
Years ago I watched a team spend a full quarter getting their Lighthouse score from 62 to 98. Conversion didn't move. Their real users — on mid-range Android phones over hotel Wi-Fi — saw exactly the same slow page as before, because the score was measured on a MacBook on office fibre. That's the first lesson of this course: a performance number is only meaningful if you know who experienced it and what it describes.
Core Web Vitals are Google's attempt to name three experiences that correlate with users leaving: did the main content show up (LCP), did the page respond when I tapped (INP), and did things jump around under my thumb (CLS).
The three metrics and their thresholds
| Metric | Question it answers | Good | Poor |
|---|---|---|---|
| LCP — Largest Contentful Paint | When did the biggest above-the-fold image or text block render? | ≤ 2.5 s | > 4.0 s |
| INP — Interaction to Next Paint | How long from a tap/click/keypress until the next frame painted? | ≤ 200 ms | > 500 ms |
| CLS — Cumulative Layout Shift | How much did visible content move unexpectedly? | ≤ 0.1 | > 0.25 |
INP replaced FID as a Core Web Vital in March 2024. FID only measured the delay before the first handler started; INP measures the full round trip for (nearly) every interaction and reports roughly the worst one. Sites that "passed" FID trivially often fail INP — that's by design.
The p75 rule
A page passes when the 75th percentile of real page loads meets the threshold, evaluated separately for mobile and desktop. Not the average, not the median. That means one in four of your users can still have a bad experience while you pass — and if you're failing, the problem is your slow tail, not your typical session. Optimizing the median is the most common way teams "improve performance" without moving the metric.
LCP has four sub-parts — learn them by heart
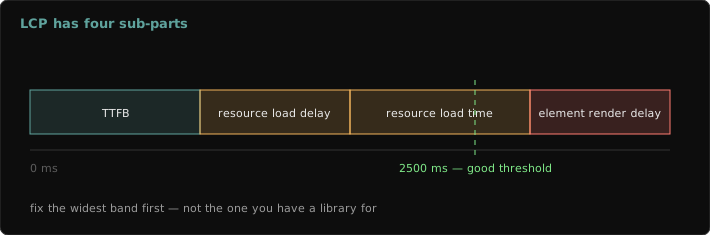
navigation start
 |-- TTFB ---------------|  server + network until first HTML byte
                         |-- resource load delay --|  HTML parsed until LCP image request starts
                                                   |-- resource load duration --|  image bytes downloading
                                                                                |-- element render delay --|  bytes arrived until pixels painted
                                                                                                           LCP
Every LCP fix targets exactly one of these. A slow backend shows up in TTFB. An image discovered late (CSS background, JS-injected, loading="lazy") shows up as load delay. A 900 KB JPEG shows up as load duration. Render-blocking CSS or a client-rendered hero shows up as render delay. If you can't say which sub-part you're fixing, you're guessing. As a rough healthy shape: TTFB and load duration take most of the budget; load delay and render delay should each be under ~10%.
CLS is about unexpected movement
Layout shifts within 500 ms of a user input are excluded — expanding an accordion you clicked is fine. CLS groups shifts into session windows (gaps under 1 s, max 5 s long) and reports the worst window. The classic offenders: images without dimensions, ad slots that collapse or grow, cookie banners injected above content, and web fonts swapping in with different metrics.
Field notes
- Lighthouse doesn't measure INP at all — there's no user interacting. Its Total Blocking Time is a lab proxy, not a substitute.
- LCP stops being recorded at the first user input, so a fast scroller can "finish" LCP early. Field numbers are noisy for reasons like this; trends matter more than any single session.
- The LCP element is frequently not what designers think it is. On mobile, it's often a text block, not the hero image. Check before optimizing.
- "We have a 98 Lighthouse score" is a statement about one synthetic run. Ask for the CrUX p75 instead.