
Lesson 5 of 9 · 28m
Unpacking: Let the Malware Do the Work
The effort ladder from upx -d to debugger breakpoints on memory APIs, catching payloads with pe-sieve, and how to know the dump is actually the payload.
The packer's whole job is to put the real payload in memory and run it. Your job is to be standing there when it does. New analysts burn days reversing a decompression routine; the senior move is to never read the algorithm at all. Set traps on the handful of APIs every unpacker must call, let the stub do its work, and collect the result.
The effort ladder — climb only as far as needed
- Known tool:
upx -d sample.exe -o sample.unpacked.exe. "Not packed by UPX" while DIE says UPX → tampered section names orUPX!magic; restore them and retry. - Sandbox dumps: CAPE captures injected and unpacked payloads automatically — check the payloads tab before opening a debugger.
- Memory scanners: run the sample in the lab VM and point pe-sieve at the process.
- Debugger breakpoints on memory APIs.
- Reversing the stub — rare, and usually a sign a step above was skipped.
The pattern every unpacker follows
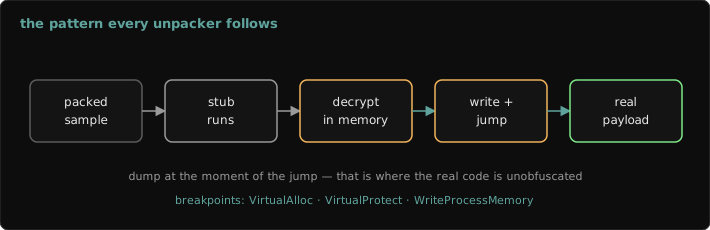
stub -> VirtualAlloc(NULL, 0x3A000, MEM_COMMIT|MEM_RESERVE, PAGE_READWRITE)
     -> decrypt / decompress payload into the buffer     ; you don't care how
     -> VirtualProtect(buf, 0x3A000, PAGE_EXECUTE_READ, &old)
     -> jmp payload OEP                                 ; self-injection
     or CreateProcessW(CREATE_SUSPENDED) -> WriteProcessMemory
        -> SetThreadContext -> ResumeThread              ; hollowing
The x64dbg recipe
bp VirtualAlloc
bp VirtualProtect
bp WriteProcessMemory
bp ResumeThread
run
At VirtualAlloc, rtr (run to return) and note RAX — the new buffer; follow it in the dump pane and bphws rax, w, 1 to watch writes until it starts with 4D 5A. At WriteProcessMemory the x64 calling convention puts args in RCX, RDX, R8, R9, so R8 is the buffer and R9 the size — save it with savedata C:\dump\payload.bin, r8, r9 and stop before ResumeThread. You've caught a hollowing payload without letting it run.
pe-sieve: the lazy (correct) first try
C:\Tools> pe-sieve64.exe /pid 4312 /shellc /imp 1
[*] Scanning: C:\Windows\SysWOW64\explorer.exe
Implanted PE: 1   Implanted shc: 0   Replaced: 0
Dumped modules to: process_4312
pe-sieve finds PEs and shellcode that don't match anything on disk — implants, hollowed images, patched modules — and dumps them realigned, with a scan_report.json explaining each flag.
Is the dump the payload?
Rerun lesson 2's triage on the dump: meaningful strings, a rich import table, .text entropy around 6, capa describing malware behaviors instead of packer behaviors. Tiny imports and another high-entropy blob means you've unpacked a layer — keep going.
Field notes
- Multi-stage is normal: loader → shellcode → loader → payload. Hash and label every stage.
- Memory dumps sit at virtual offsets — fine for strings/capa/YARA; for a runnable PE let pe-sieve unmap it or rebuild imports with Scylla.
IsDebuggerPresent,PEB.BeingDebugged, and timing checks will fight you; ScyllaHide handles most.- .NET loaders usually end in
Assembly.Load(byte[])— breakpoint it in dnSpy and save the byte array. - Report both hashes: the packed file is what IR blocks on disk, the payload hash is what clusters the family.